Rust Benchmark
using the criterion crate
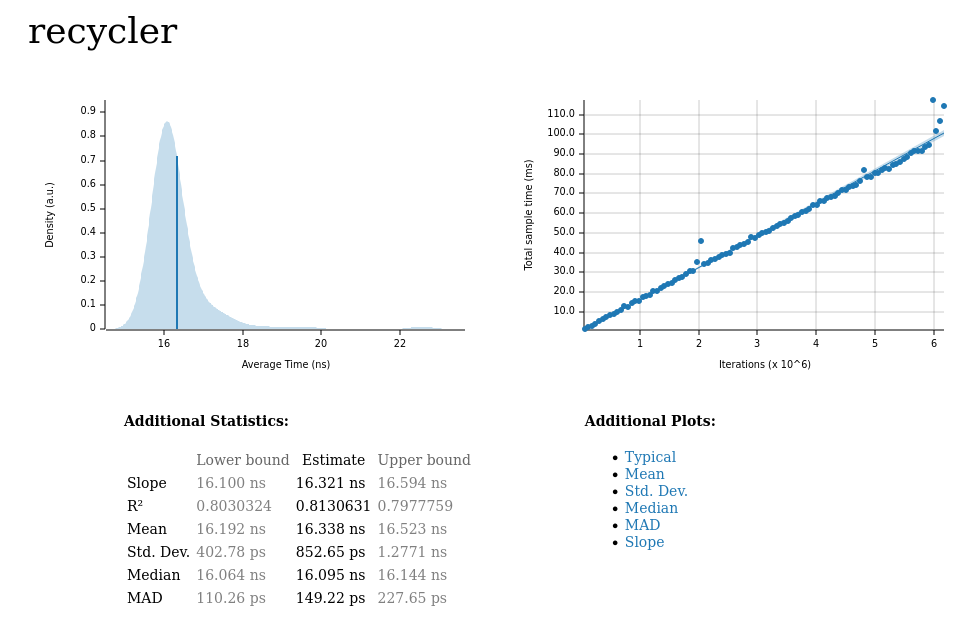
This is a very very basic demo I made to learn how to benchmark my own function.
I made a new project, added a lib.rs and then made a function inside lib.rs called “cycler”
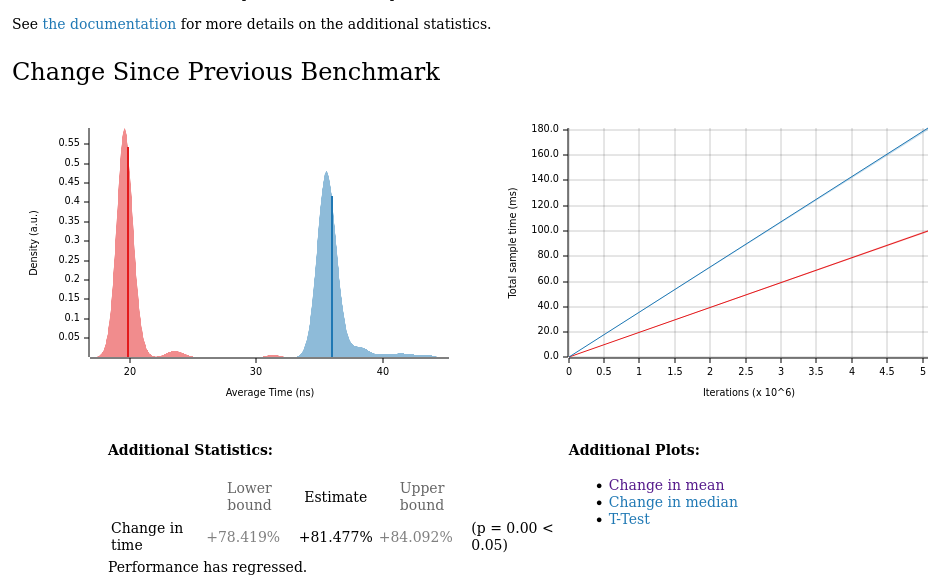
This is a tiny function so won’t really make full use of the benchmarks but I wanted to keep it simple, and then make the function deliberately slower to see what happened! (As you can see above, the performance REGRESSED)!

The code
To follow along you add a directory called “benches” and then create your file – mine is called “range_benchmark.rs” – this is where you add all the “criterion stuff”.
Note how the name of the file matches what is in the Cargo.toml file?
❯ tree -L 2
.
├── benches
│   └── range_benchmark.rs
├── Cargo.lock
├── Cargo.toml
├── src
│   ├── lib.rs
│   └── main.rs
└── target
    ├── CACHEDIR.TAG
    ├── criterion
    ├── debug
    ├── nextest
    ├── release
    └── tmp
[package]
name = "p180"
version = "0.1.0"
edition = "2021"

[dependencies]

[dev-dependencies]
criterion = {version = "0.3", features = ["html_reports"]}

[[bench]]
name = "range_benchmark"
harness = false
As you can see, the bench name doesn’t need to match the project name…
pub fn cycler(range:std::ops::Range<usize>)->Vec<usize>{
        // Collect the range into a Vec<usize>
    let range = range.into_iter().collect::<Vec<usize>>();

    // Perform some computation to make the operation more complex
    range.iter().map(|&x| x * 2).collect() // Just doubling each value for now
}
use criterion::{black_box, criterion_group, criterion_main, Criterion};
use p180::cycler; // function to profile
pub fn criterion_benchmark(c: &mut Criterion) {
// Profile the cycler function
c.bench_function("cycler", |b| {
b.iter(|| black_box(cycler(0..11))); // Use black_box to prevent optimization
});
}
criterion_group!(benches, criterion_benchmark);
criterion_main!(benches);
❯ pwd
/home/rag/p180/target
❯ tree -L 2
.
├── CACHEDIR.TAG
├── criterion
│ ├── cycler
│ └── report
├── debug
│ ├── build
│ ├── deps
│ ├── examples
│ ├── incremental
│ ├── libp180.d
│ ├── libp180.rlib
│ ├── p180
│ └── p180.d
├── nextest
│ └── default
├── release
│ ├── build
│ ├── deps
│ ├── examples
│ ├── incremental
│ └── p180
└── tmp
16 directories, 6 files
~/p180/target main* ❯
You can navigate to report and then use “firefox index.html” to open the html report which has the plots that we see on this page.
Why did it regress?
because I deliberately added this to my original function, in src/lib.rs, so as to make a noticeable difference for criterion for observe!
// Perform some computation to make the operation more complex
range.iter().map(|&x| x * 2).collect() // Just doubling each value for now
Improve the performance
pub fn cycler(range:std::ops::Range<usize>)->Vec<usize>{
// Collect the range into a Vec<usize>
let range = range.into_iter().collect::<Vec<usize>>();
range
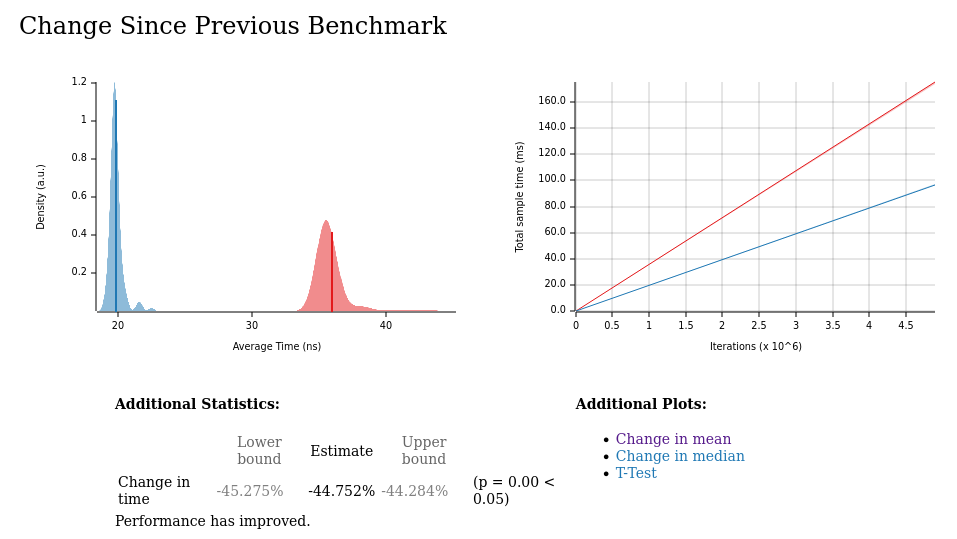
}What does it show when the code is improved?
❯ cargo bench
Compiling p180 v0.1.0 (/home/rag/p180)
Finished `bench` profile [optimized] target(s) in 1.24s
Running unittests src/lib.rs (target/release/deps/p180-2596068b6c8fb8ad)
running 0 tests
test result: ok. 0 passed; 0 failed; 0 ignored; 0 measured; 0 filtered out; finished in 0.00s
Running unittests src/main.rs (target/release/deps/p180-be45702ecfb86b95)
running 1 test
test tests::test_cycler ... ignored
test result: ok. 0 passed; 0 failed; 1 ignored; 0 measured; 0 filtered out; finished in 0.00s
Running benches/range_benchmark.rs (target/release/deps/range_benchmark-5fc0b38294993391)
Gnuplot not found, using plotters backend
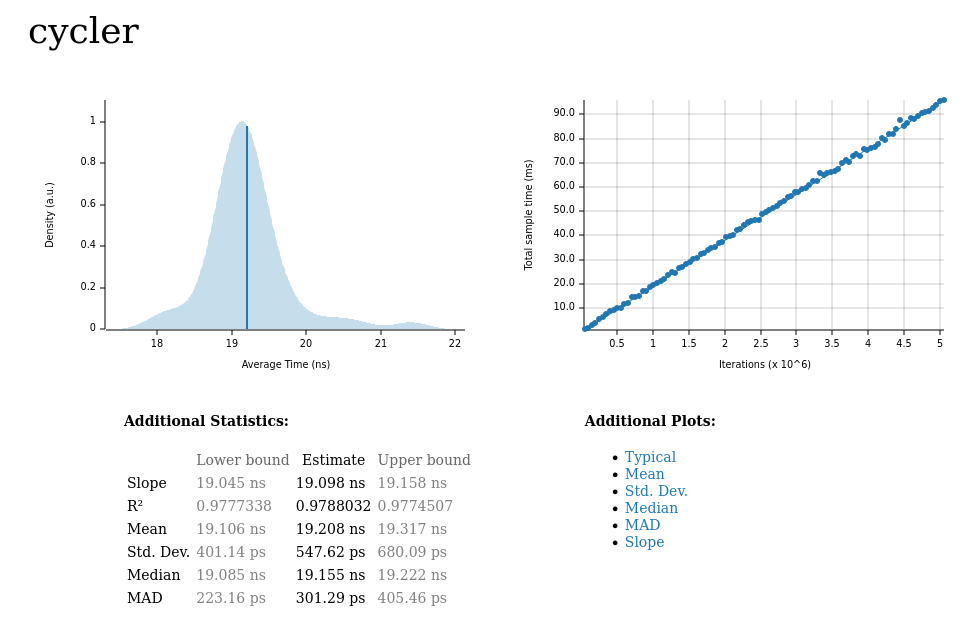
cycler time: [19.741 ns 19.796 ns 19.862 ns]
change: [-45.275% -44.752% -44.284%] (p = 0.00 < 0.05)
Performance has improved.
Found 12 outliers among 100 measurements (12.00%)
3 (3.00%) low mild
5 (5.00%) high mild
4 (4.00%) high severe
Tip:
Run with verbose
Running `/home/rag/p180/target/release/deps/range_benchmark-5fc0b38294993391 --bench`
Gnuplot not found, using plotters backend
cycler                  time:   [19.614 ns 19.696 ns 19.829 ns]
                        change: [-0.9919% -0.2145% +0.6550%] (p = 0.60 > 0.05)
                        No change in performance detected.
Found 10 outliers among 100 measurements (10.00%)
  1 (1.00%) low mild
  5 (5.00%) high mild
  4 (4.00%) high severe

~/p180 main* 12s ❯ cargo bench --verbose
Compare functions – select the best
If you had 2 functions which produce the same output, you could evaluate both in terms of performance and select the quickest one?